non-coding regionのSNPデータを解析する
##SNPの意外な活用法
SNP(Single Nucleotide Polymorphism)の解析と言ったらはGWASの中で疾患との相関を調べたりするのに使われるものだと思っていたが、実はゲノム編集細胞のQCにも非常によく活用することができるということを最近業務の中で知った。
たとえば、SNPデータは以下のようなことに使える。
- 配列を変更したい時に天然のバリアントを利用することができる
- Single cell cloneだったものがモザイクになったら不均一集団になってしまっている
このように、GRCh38 (hg38) のリファレンス配列だけでなくSNPにまで目を向けると色々なことが分かるようになる。(実際は同僚に教えてもらったのだが・・・)
年の瀬を迎え、時間もできたことだし、予てから気になっていたDB情報を活用する方法について調べてみた。
##データベースの選定
データベースには以下のものなどがあるが、dbSNPには全てのデータが統合されている。
| データベース | データの種類 | データ量 | 更新頻度 | アクセス方法 | 主な用途 |
|---|---|---|---|---|---|
| dbSNP | SNP、indel、マイクロサテライトなど | 33億件のSNPレコード、11億件のReference SNPレコード | 約3~4か月ごと | Entrez SNP検索ツール、バッチクエリ | ゲノムワイド関連解析、集団遺伝学、進化生物学 |
| ClinVar | 遺伝的バリアントと疾患の関係 | 82.5万件以上のレコード、50万件以上のバリアント | 毎週、毎月包括的なリリース | E-utilities、Entrez Direct | バリアントの臨床的意義の解釈、医療遺伝学 |
| gnomAD | エクソン、ゲノム | 730,947のエクソームシーケンス、76,215の全ゲノムシーケンス (v4.1) | 各gnomADリリースごと | gnomADブラウザ、AWS、Microsoft Azure、Google Cloud | 希少バリアントの解析、遺伝子機能の研究 |
| 1000 Genomes Project | ゲノム | 2,504人分のゲノムデータ (Phase 3) | 更新なし | IGSRデータポータル、AWS、Ensembl、UCSC Genome Browser | 集団遺伝学、ヒト遺伝的多様性の研究 |
###dbSNPとは
dbSNPは、NCBI(National Center for Biotechnology Information)がNHGRI(National Human Genome Research Institute)と共同で開発・運営している、様々な生物種の遺伝的変異に関する情報を集約した無料の公開データベース。dbSNPは、1998年に設立され、ヒトゲノムプロジェクトで発見された多数の共通変異を収容するために作成された。dbSNPには、単一塩基置換、短い欠失・挿入多型、マイクロサテライトマーカー、レトロトランスポゾンなどの多様な分子多型が含まれている。
エントリ数が多いのは素晴らしいが、false positive rateが高いという指摘があるらしい。wikipediaでの指摘は論文での考察結果がよくまとまっているので参照されたし。
##dbSNPを使って特定の領域に含まれるSNPデータを全て取得する
dbSNPではchromosome, start position, end positionなどを指定して検索することができる。

使用可能な特殊クエリには以下のようなものがある。6[Chromosome]のように、検索後を特殊カッコの前に付けて使用する。
Gene Nameを指定したとしてもexonないしはintronが対象になるだけなので、promoter配列やそれより上流は染色体位置などを参考にしないといけない。
- [Chromosome]
- 1000[Base Position] : 2000[Base Position]
- [Gene Name]
- [Validation Status]
- [Function Class]
- [SNP ID]
- [SNP Class]
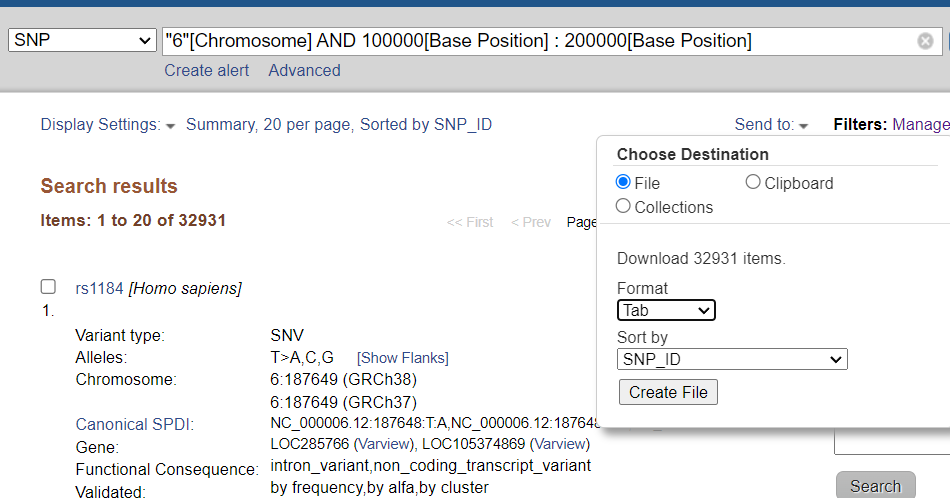
検索画面右上から検索結果をtsvで出力することも可能。出力には結構時間がかかるので気長に待つ。APIでダウンロードできるような記述をChatGPTが返してくることもあったが、未検証。
##データ分析例
出力データは以下のようになった。
#chr	pos	variation	variant_type	snp_id	clinical_significance	validation_status	function_class	gene	frequency
6	187649	T>A,C,G	snv	1184		by-frequency;by-alfa;by-cluster	intron_variant;non_coding_transcript_variant	LOC285766;LOC105374869	T:0.066677:427:1000Genomes|T:0.078473:148:HapMap|T:0.035495:104:KOREAN|T:0.071429:4:Siberian|T:0.040873:57:TOMMO|T:0.088145:23331:TOPMED|T:0.109392:3359:ALFA
6	102893	A>G	snv	382895		by-frequency;by-alfa			G:0.:0:ALFA
6	103136	C>A	snv	462661		by-cluster
6	103505	T>C,G	snv	467420		by-cluster
6	165632	A>C,G,T	snv	719065		by-frequency;by-alfa;by-cluster			A:0.349781:2240:1000Genomes|A:0.293186:611:HGDP_Stanford|A:0.413136:780:HapMap|G:0.430034:1260:KOREAN|G:0.411572:754:Korea1K|G:0.323529:22:Qatari|A:0.:0:SGDP_PRJ|A:0.211538:11:Siberian|G:0.453075:12803:TOMMO|A:0.272368:72093:TOPMED|A:0.19265:6060:ALFA
Frequencyというカラムの値が一定値以上のもとを取ってくるなどすれば先程のfalse positive問題は回避できそう。
###データ読み込み
o1のコードだが、データの整理からしてみる。
import pandas as pd
import numpy as np

# TSVを読み込む
df = pd.read_csv("snp_result.txt", sep="\t",  dtype=str)
# frequency列がNaNの場合は除外
df = df[~df["frequency"].isna()]

# frequency列が空文字や"0."のみのような場合を除外する関数を定義
def has_valid_freq(freq_str):
    # freq_strが空ならFalse
    if not freq_str.strip():
        return False
    # パイプで区切られた各エントリに少なくとも一つ数値が入っていればTrue
    items = freq_str.split("|")
    for item in items:
        # 例: "T:0.066677:427:1000Genomes"
        parts = item.split(":")
        if len(parts) == 4:
            allele, freq_val, count, dataset = parts
            # freq_valが数値かつ0以外ならvalidとみなす
            try:
                val = float(freq_val)
                if val > 0.0:
                    return True
            except ValueError:
                pass
    return False

df = df[df["frequency"].apply(has_valid_freq)]

# frequency列を展開してtidyにする
rows = []
for idx, row in df.iterrows():
    freq_entries = row["frequency"].split("|")
    for entry in freq_entries:
        parts = entry.split(":")
        if len(parts) == 4:
            allele, freq_val, count, dataset = parts
            # freq_valが数値に変換できなければスキップ
            try:
                val = float(freq_val)
            except ValueError:
                continue
            # 0以下はスキップ
            if val <= 0.0:
                continue
            row_dict = {
                "#chr": row["#chr"],
                "pos": row["pos"],
                "variation": row["variation"],
                "variant_type": row["variant_type"],
                "snp_id": row["snp_id"],
                "clinical_significance": row["clinical_significance"],
                "validation_status": row["validation_status"],
                "function_class": row["function_class"],
                "gene": row["gene"],
                "allele": allele,
                "frequency": val,
                "sample_count": count,
                "dataset": dataset
            }
            rows.append(row_dict)

tidy_df = pd.DataFrame(rows)

tidy_df
これでtidyな使えるデータになる。
  #chr     pos variation variant_type  snp_id  clinical_significance  \
0    6  187649   T>A,C,G          snv    1184                    NaN
1    6  187649   T>A,C,G          snv    1184                    NaN
2    6  187649   T>A,C,G          snv    1184                    NaN
3    6  187649   T>A,C,G          snv    1184                    NaN
4    6  187649   T>A,C,G          snv    1184                    NaN
5    6  187649   T>A,C,G          snv    1184                    NaN
6    6  187649   T>A,C,G          snv    1184                    NaN
7    6  165632   A>C,G,T          snv  719065                    NaN
8    6  165632   A>C,G,T          snv  719065                    NaN
9    6  165632   A>C,G,T          snv  719065                    NaN

                 validation_status  \
0  by-frequency;by-alfa;by-cluster
1  by-frequency;by-alfa;by-cluster
2  by-frequency;by-alfa;by-cluster
3  by-frequency;by-alfa;by-cluster
4  by-frequency;by-alfa;by-cluster
5  by-frequency;by-alfa;by-cluster
6  by-frequency;by-alfa;by-cluster
7  by-frequency;by-alfa;by-cluster
8  by-frequency;by-alfa;by-cluster
9  by-frequency;by-alfa;by-cluster

                                 function_class                    gene  \
...
6      T   0.109392         3359           ALFA
7      A   0.349781         2240    1000Genomes
8      A   0.293186          611  HGDP_Stanford
9 A 0.413136 780 HapMap ###datasetの種類
特定のSNP_IDに対して様々なdatasetの測定結果が格納されているらしい。どんなdatasetがあるのかみてみる。
tidy_df['dataset'].unique()array(['1000Genomes', 'HapMap', 'KOREAN', 'Siberian', 'TOMMO', 'TOPMED',
'ALFA', 'HGDP_Stanford', 'Korea1K', 'Qatari', 'Daghestan',
'GnomAD', 'PAGE_STUDY', 'GENOME_DK', 'SGDP_PRJ', 'PRJEB36033',
'NorthernSweden', 'GoNL', 'ALSPAC'], dtype=object)経験的にこういうデータって欠損値だらけのdatasetが含まれていることが多く、省けるものもあったりする。どのdatasetに欠損が多いか確認してみる。
import polars as pl

# polars objに変換
df_tidy = pl.DataFrame(tidy_df)

# wide dataに変換 この操作はpolarsの方がやりやすい
df_freq = df_tidy.select(
    [
        # '#chr',
        # 'pos',
        # 'variation',
        # 'variant_type',
        'snp_id',
        # 'function_class',
        'frequency',
        # 'sample_count',
        'dataset'
        ]
).pivot('dataset', index='snp_id', aggregate_function='first').fill_null(0.0).filter(
    (pl.col('TOMMO') > 0.0) | (pl.col('1000Genomes') > 0.0)
).head(20)

df_heat = df_freq.to_pandas().set_index('snp_id')
df_heat


# pyComplexHeatmapでplot
import matplotlib.pylab as plt
import numpy as np
plt.rcParams['figure.dpi'] = 100
plt.rcParams['savefig.dpi']=300
plt.rcParams['font.family']='sans serif' #please remove this line if font is not installed
plt.rcParams['font.sans-serif']='Arial' # please remove this line if Arial font is not installed
plt.rcParams['pdf.fonttype']=42
# sys.path.append(os.path.expanduser("~/Projects/Github/PyComplexHeatmap/"))
import PyComplexHeatmap as pch

plt.figure(figsize=(5, 5))
pch.ClusterMapPlotter(data=df_heat, col_cluster=False, row_cluster=False, show_colnames=True,
                      show_rownames=True)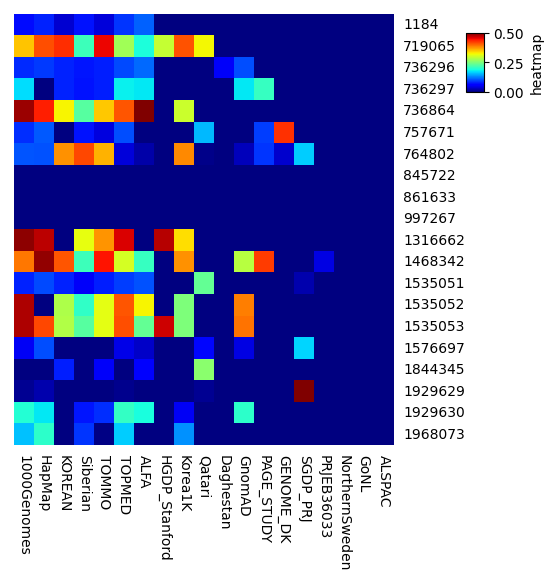
大体以下のような知見が得られた。(主観です) 今回は試しにchromosome6のごくごく一部のSNPだけを題材にしてみたが、もっと広いところを見れば異なるdatasetもあるのだと思う。用途に応じて使い分けると良さそう。
データが多いがほかのdatasetとはfrequencyの傾向が違う
- 10000Genomes
- HapMap
しっかりデータが多い
- KOREAN
- Siberian
- TOMMO
- ALFA
- Korea1K
少しデータが足りない
- HGDP_Stanford
- Qatari
- GnomAD
データ不足でスクリーニング用途では使えなそう
- Daghestan
- PAGE_STUDY
- GENOME_DS
- SGDP_PRJ
- PRJE36033
- NorthernSweden
- GoNL
- ALSPAC
-
wikipedia参照. ↩